Record increase in drug use in Australia
Australian Criminal Intelligence Commission’s Report 25 of the National Wastewater Drug Monitoring Program.
Data collected from December 2024 to October 2025.
Australia’s latest wastewater analysis provides one of the clearest, most objective snapshots of drug use across the population. For employers, HR leaders and safety professionals, it offers real evidence of what’s happening beneath the surface, not just what’s reported.
The findings from the National Wastewater Drug Monitoring Program highlight a consistent trend. Drug consumption in Australia is, unfortunately, not declining. In lots of cases, it is actually increasing. It goes without saying that that is hazardous for the workplace.
What wastewater data actually shows
Wastewater monitoring measures drug metabolites excreted by the population. This allows authorities to estimate total consumption levels across cities and regions, independent of self-reporting or surveys.
One of the biggest advantages of wastewater analysis is that it removes bias. It does not rely on self-reporting, workplace disclosure or survey accuracy. Instead, it provides a population-level view of actual behaviour.
In the most recent reporting period, the program covered around 57% of the Australian population, or approximately 14.5 million people. This scale makes it one of the most reliable indicators of real-world drug use trends.
Drug use in Australia is at record levels
Across the four major illicit drugs monitored, consumption has reached its highest levels since reporting began.
Methylamphetamine (meth) remains the dominant drug nationally, both in volume and harm, and Australia ranks among the highest globally for its use. Cocaine (coke) and heroin have also reached record highs, while MDMA appears to be stabilising after previous increases.
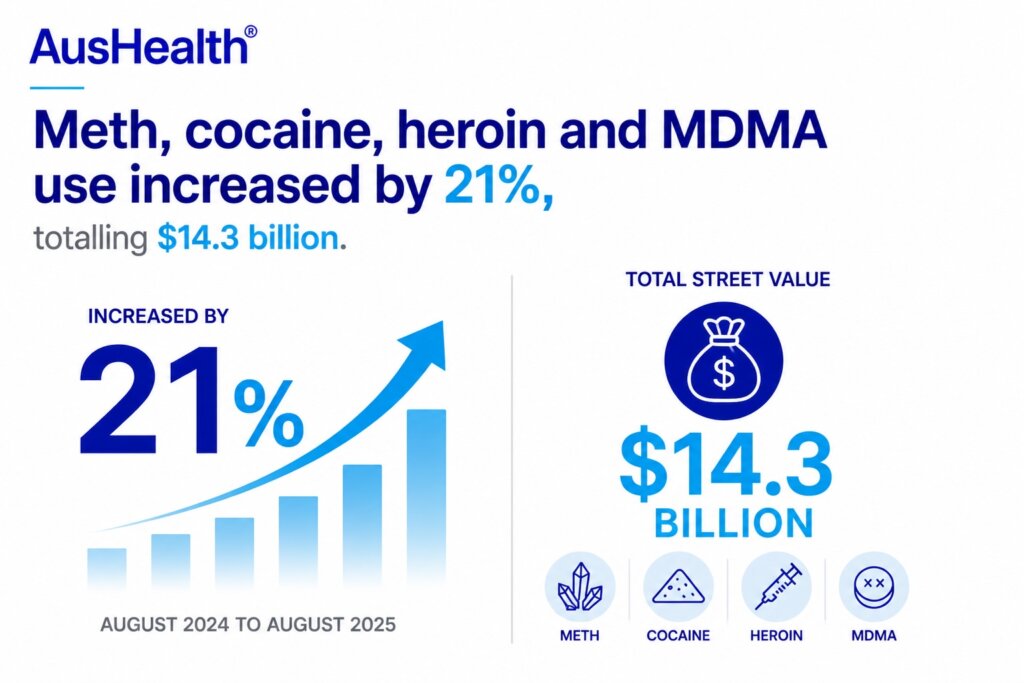
Between August 2024 and August 2025 total consumption increased by 21%, which equates to an additional 4.6 tonnes of drugs consumed nationally.
There was an estimated almost 16,000 kilograms of meth consumed in that time. As well as, nearly 8000 kilograms of coke.
Meth, coke, heroin and MDMA usage has risen 21% from August 2024 to August 2025, which has an estimated street value total of $14.3 billion.
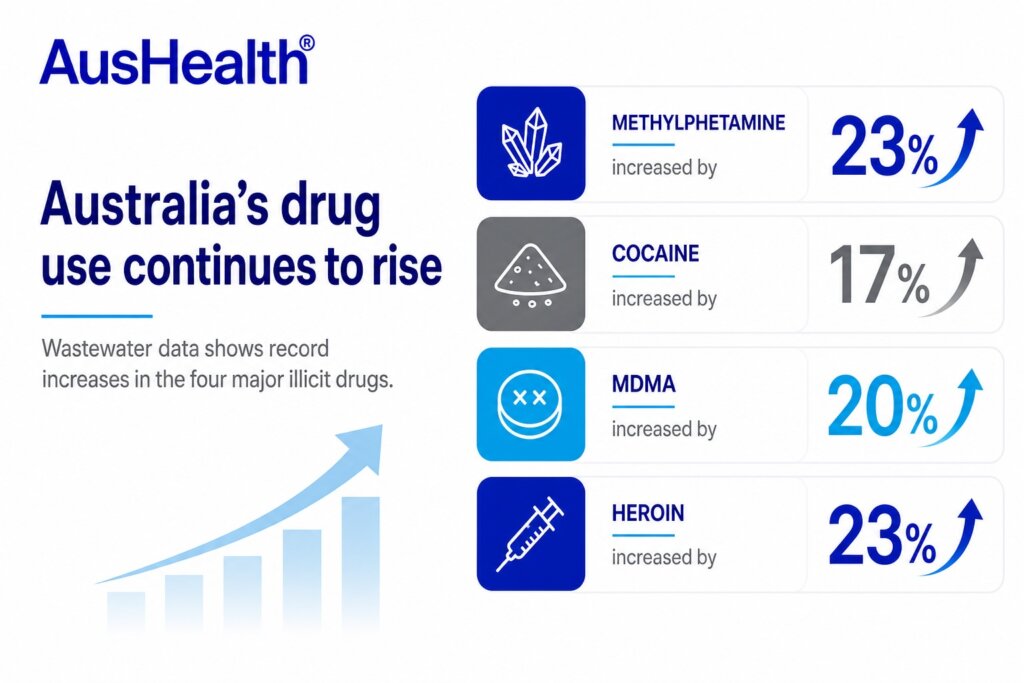
Individually:
- methylamphetamine increased by 23%
- cocaine increased by 17%
- MDMA increased by 20%
- heroin increased by 23%
For workplaces it reflects a larger proportion of the workforce potentially impacted by substance use, whether directly or indirectly.
Methylamphetamine remains the dominant risk
Methylamphetamine continues to dominate Australia’s drug landscape. It accounts for the largest share of total consumption, the majority of market value and poses significant community harm.
Australia also ranks second highest globally for methylamphetamine use.
From a workplace perspective, this matters because stimulant use is strongly linked to:
- fatigue and burnout cycles
- impaired judgement
- increased risk-taking behaviour
- safety incidents in high-risk industries.
Cocaine and MDMA trends are shifting
Cocaine consumption is rising rapidly and is now at record levels, particularly in capital cities. MDMA shows mixed patterns, with signs it may be stabilising after previous increases.
This reflects changing social and recreational behaviours, especially in urban workforces. It also suggests that drug use is not limited to one demographic or industry.
Regional versus city differences matter
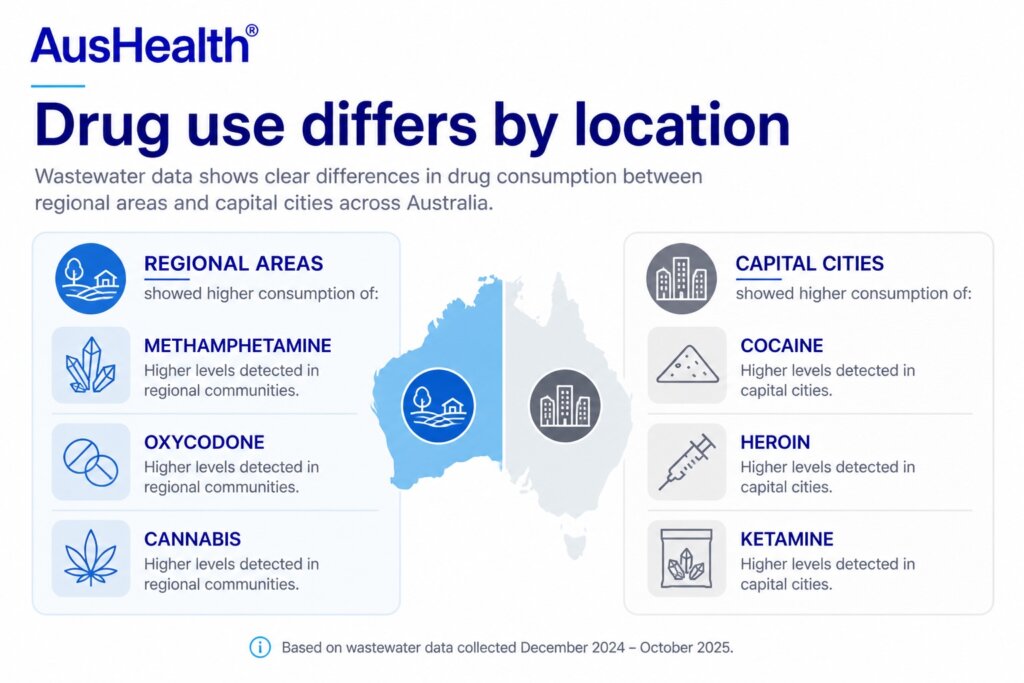
Wastewater data shows clear variation between capital cities and regional areas.
Drug consumption patterns differ based on:
- location
- access to supply
- local industry and workforce composition
This reinforces a key point for employers. A one-size-fits-all policy is rarely effective. Risk profiles should be tailored to the specific workforce and location.
The data also highlights clear differences between capital cities and regional areas. Regional areas tend to show higher consumption of drugs like meth, oxycodone and cannabis, while capital cities have higher levels of cocaine, heroin and ketamine. This reinforces that drug use patterns are not uniform and vary based on location and access.
State by state
‘Tasmania recorded the largest annual increase in meth use (38%), followed by the Northern Territory (36%) and the Australian Capital Territory (30%), while cocaine use rose by 36% in the NT and 33% in Western Australia,’ The Guardian states.
New South Wales (NSW)
Largest total consumption across most drug types. Strong growth in methylamphetamine and cocaine, both at record levels. Cocaine is particularly prominent compared to other states. Heroin also increased significantly. Overall, NSW reflects a high-demand, high-supply market across all major drugs.
Victoria (VIC)
High overall consumption but more balanced across drug types. Strong increases in methylamphetamine and cocaine, though slightly lower growth compared to NSW. MDMA shows some softening or decline. Heroin remains relatively stable with moderate growth. Mix of metro and regional variation is pronounced.
Queensland (QLD)
Significant growth across all major drugs, especially methylamphetamine and cocaine. One of the larger increases nationally. Regional areas contribute heavily to overall consumption. Heroin also rising, indicating a broadening drug profile beyond stimulants.
Western Australia (WA)
Moderate-to-high consumption with steady growth. Methylamphetamine remains dominant, consistent with historical trends. Cocaine is increasing but still lower than east coast states. Regional consumption is a key driver, particularly for meth.
South Australia (SA)
Mid-range consumption overall but clear increases across methylamphetamine and cocaine. Regional areas show higher usage than metro in several substances. MDMA shows mixed results. Heroin growth is present but less pronounced than larger states.
Tasmania (TAS)
Lower total consumption due to population size, but relatively high per-capita variability. Noticeable fluctuations across all drugs. Some spikes in cocaine and MDMA in specific sites. Alcohol and cannabis remain significant contributors.
Northern Territory (NT)
Small population but high variability and volatility in data. Some extreme spikes in certain substances due to smaller sample sizes. Cannabis and alcohol stand out, with inconsistent but notable activity in other drugs.
Australian Capital Territory (ACT)
Lower overall volume but relatively high per-capita usage in some substances, particularly cocaine. More metro-driven patterns. Less regional variation compared to other jurisdictions. Drug profile leans more towards stimulants than opioids.
Legal drugs
The findings also confirm that cannabis remains the most widely consumed illicit drug, even though usage fluctuates. Alcohol and nicotine consumption continue to far exceed all other substances, reflecting their legal status and broader population use.
What this means for workplace safety
The data confirms that drug use is a persistent and growing factor in Australia’s risk landscape.
For employers, the implications include:
- increased likelihood of impairment in the workplace
- higher safety risks in industries such as construction, transport and mining
- greater need for clear policies and consistent enforcement
- a stronger case for proactive testing and education.
It also reinforces the importance of early intervention. Waiting until an incident occurs is significantly more costly than prevention. That’s why we always encourage wellbeing programs to be implemented into the workplace.